Difference between revisions of "SSH Monitoring with Zabbix"
| (2 intermediate revisions by the same user not shown) | |||
| Line 21: | Line 21: | ||
== SSH based detailed monitoring == | == SSH based detailed monitoring == | ||
| − | <div style="border: 4px solid brown; padding: 10px;">IMPORTANT: The SSH check in Zabbix 5 | + | <div style="border: 4px solid brown; padding: 10px;">IMPORTANT: The SSH check in Zabbix 5 was very buggy and not well documented during our tests. [https://support.zabbix.com/browse/ZBX-17756 At this time, a specific bug stoped us from utilizing this technique.] (June 2020). The reason was ''libssh'' and should be fixed with libssh 0.9.5 or later on your Zabbix server machine ([https://bugs.libssh.org/T231 libssh bug info]). If you encounter login issues, please check if your libssh is version 0.9.5 or later. You may want to download [https://www.libssh.org/get-it/ libssh source] and compile by yourself.</div> |
| Line 33: | Line 33: | ||
It will ask you for a password. Please use a very secure password (>= 12 characters). | It will ask you for a password. Please use a very secure password (>= 12 characters). | ||
| − | In most cases, the permisions of the new zabbix user will be sufficient. | + | In most cases, the default permisions of the new zabbix user will be sufficient for the monitoring tasks. |
=== Configure Zabbix monitoring items === | === Configure Zabbix monitoring items === | ||
Latest revision as of 09:03, 9 November 2020
The ZBX agent is not installed on the regify appliance and you are not allowed to install third party software. But it is easy to monitor the regify appliance with Zabbix using SSH agent.
Contents
Basic URL based monitoring
This kind of monitoring is based on the built-in monitoring script of the regify provider appliance. It is available using the URL of this scheme: https://providerDomain/monitoring.php. It either returns OK, WARNING: xxx or ERROR: xxx (or nothing if server is down).
Configure Zabbix Web Scenario
- Create a new Web scenario and give it a name like "Test regify provider appliance availability".
- Select "Zabbix" as agent.
- Now switch to Steps and add a new step.
- Give it a name like "Check Result" and enter the URL like "https://providerdomain.com/monitoring.php".
- Dont add any fields, variables and headers here.
- The timeout should be "5s".
- The "Required string" should be "OK".
- The "Required status codes" should be "200".
- You can switch to Authentication and enable "SSL verify peer" and "SSL verify peer" if you like to also verify SSL certificate validity in the same step.
- Now you can save/add/update the Web Scenario.
- You should also create a Trigger for this.
- We created a "High" severity trigger with this expression:
{Provider:web.test.fail[Test regify provider appliance availability].last()}>0
SSH based detailed monitoring
Allow appliance login
Login with SSH to the regify appliance with root user. Then, create a user for zabbix monitoring:
adduser zabbix
passwd zabbix
It will ask you for a password. Please use a very secure password (>= 12 characters).
In most cases, the default permisions of the new zabbix user will be sufficient for the monitoring tasks.
Configure Zabbix monitoring items
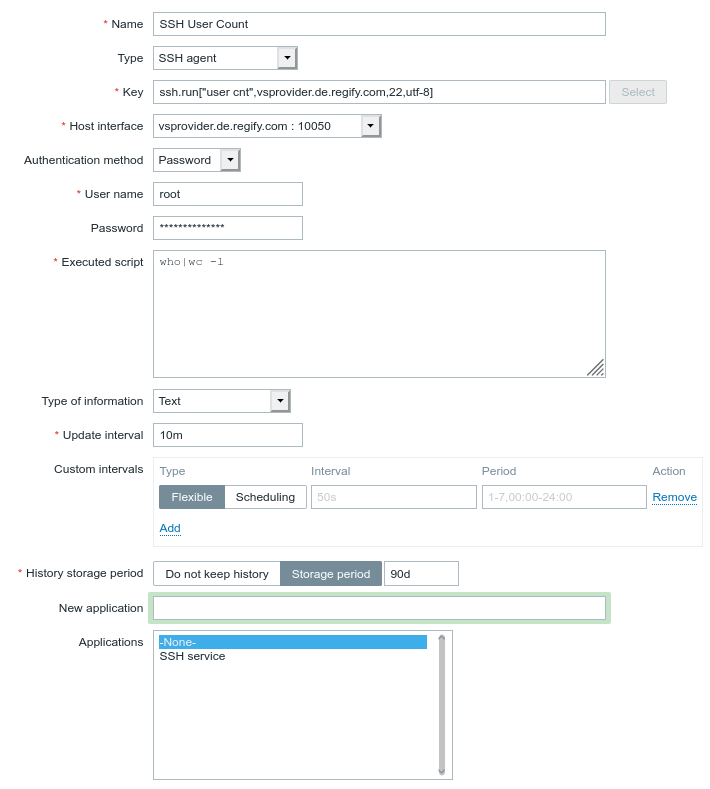
In Zabbix, create a new host (eg "regify provider"). For the new host, you need to add SSH items for tests.
The following image is showing an item for checking current SSH user count on the machine every 10 minutes:

useful item commands
Free appliance memory in percent:
free|grep "Mem:"|awk '{print ($4+$6)/($2/100)}'
Used disk space on / in percent:
df|grep "/$"|awk '{print $5}'|tr -d "%"
CPU load average of the last 5 minutes:
cat /proc/loadavg|cut -d " " -f2
Number of active SSH logins:
who|wc -l
Current MariaDB status:
systemctl status mariadb|grep active
Zabbix optimization and bugs
If you encounter strange errors, please try to increase the timeout value in /etc/zabbix/zabbix_server.conf and /etc/zabbix/zabbix_agent.conf:
timeout=30
Sometimes the result does not come back fast enough for Zabbix and this will fix such issues.