Difference between revisions of "SSH Monitoring with Zabbix"
| Line 40: | Line 40: | ||
== Zabbix optimization and bugs== | == Zabbix optimization and bugs== | ||
| − | + | If you encounter strange errors, please try to increase the timeout value in '''/etc/zabbix/zabbix_server.conf''' and '''/etc/zabbix/zabbix_agent.conf''': | |
timeout=30 | timeout=30 | ||
| − | |||
| − | + | Sometimes the result does not come back fast enough for Zabbix and this will fix such issues. | |
Revision as of 08:47, 18 June 2020
The ZBX agent is not installed on the regify appliance and you are not allowed to install third party software. But it is easy to monitor the regify appliance with Zabbix using SSH agent.
Contents
Allow appliance login
Login with SSH to the regify appliance with root user. Then, create a user for zabbix monitoring:
adduser zabbix
passwd zabbix
It will ask you for a password. Please use a very secure password (>= 12 characters).
In most cases, the permisions of the new zabbix user will be sufficient.
Configure Zabbix monitoring items
In Zabbix, create a new host (eg "regify provider"). For the new host, you need to add SSH items for tests.
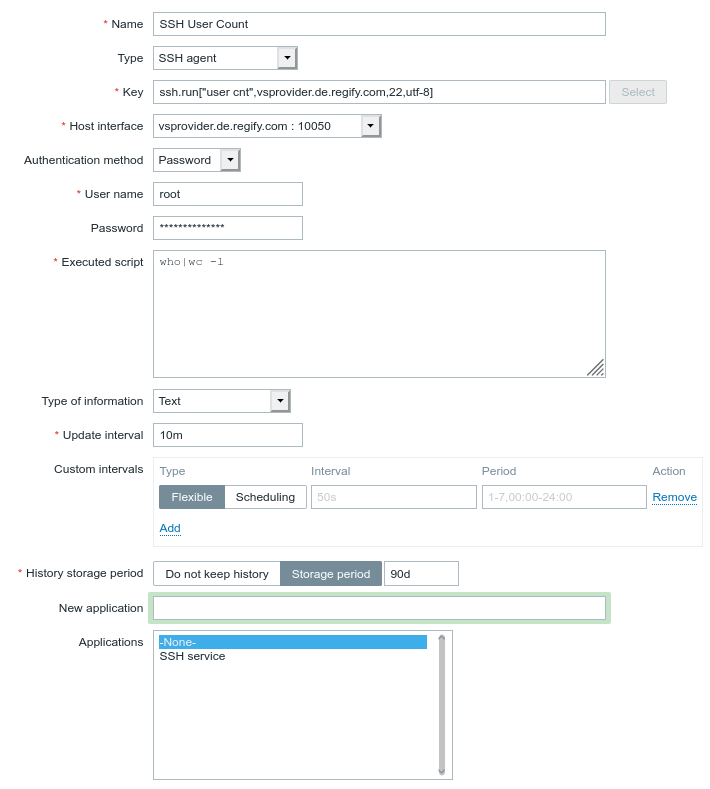
The following image is showing an item for checking current SSH user count on the machine every 10 minutes:

useful item commands
Free appliance memory in percent:
free|grep "Mem:"|awk '{print ($4+$6)/($2/100)}'
Used disk space on / in percent:
df|grep "/$"|awk '{print $5}'|tr -d "%"
CPU load average of the last 5 minutes:
cat /proc/loadavg|cut -d " " -f2
Number of active SSH logins:
who|wc -l
Current MariaDB status:
systemctl status mariadb|grep active
Zabbix optimization and bugs
If you encounter strange errors, please try to increase the timeout value in /etc/zabbix/zabbix_server.conf and /etc/zabbix/zabbix_agent.conf:
timeout=30
Sometimes the result does not come back fast enough for Zabbix and this will fix such issues.